

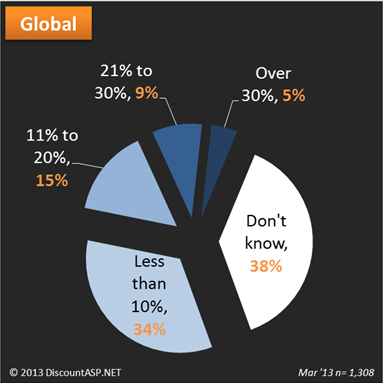
We asked, What was the percentage of your web site traffic coming from mobile (smartphones and tablets) in 2012?
This is how our users answered:

Well, for those of you who don’t know how much of your traffic is coming from Mobile clients, we have SmarterStats to help you find out.
If you haven’t enabled SmarterStats for your hosting account, here’s how to do it:
Log in to Control Panel and go to Stats / Raw Logs.
Click the Enable button next to SmarterStats (Free) (Yup, that’s right! We provide this to you for free. 🙂 )
Alright Martin I have enabled SmarterStats what do I do now?
Well now all you have to do is relax for about an hour and let SmarterStats process the HTTP logs for your site. SmarterStats processes our HTTP server logs for your site to provide you a nice interface.
After the hour has passed, login to your SmarterStats account. You can find the login information in the Stats / Raw Logs section of Control Panel.
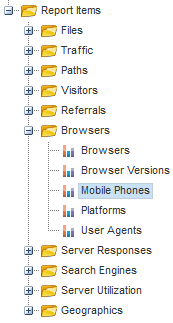
When you log in, expand the Report Items folder and expand the Browsers folder too.
Now click on Mobile Phones.

Cool Martin! Now how do I save this report and change the date range at the same time?
Well… if you like the report you see and you would also like to change the date range, all you have to do is click on the Add Favorite icon in the report you just clicked on.
![]()

This will then open the Following Window:
![]()

Click on the drop down menu next to Default Date Range and choose the date range you wish to use. Then go ahead and choose any of the other settings you wish to use and click on the OK button.
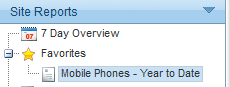
This report will be placed in the Favorites section in SmarterStats.

Another cool thing you can do to stay in the loop is to set up a Custom Report. That way you can have the report emailed to you daily, weekly, or monthly.
Expand the Custom Reports folder. Now click on the New Custom Reports.
![]()

The following web page will appear:
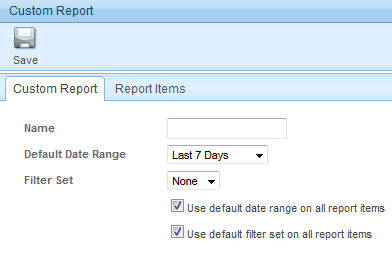

Go ahead and enter a name for your report in the name field, choose the Default Date Range, and click on the Report Items tab.
Click Add Item.
Click the drop down menu next to Report Item and select the favorite report you just created.
Now click Save.
This report will now be in your Custom Reports folder.
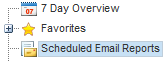
Click on the Scheduled Email Reports icon.

Click on the Add Email Report icon.
From the Reports drop down menu select the report you just created.
In the Frequency field select how often you wish to receive this report.
In the To field enter the email address you wish to send to.
Now click on Optional tab to add more email address to send to.
You might also want to place a check next to Enable graphical charts (HTML only) that way you get a nice graphical chart to refer to in your email message.
Click Save when finished.
Well, with all that said and done, I hope this helped some of you stay up to date with what type of traffic your web site is receiving.